Dosimetric impact of bowel filling during proton therapy for paediatric abdominal neuroblastoma
Ana-Cristina Ghica,
United Kingdom
MO-0384
Abstract
Dosimetric impact of bowel filling during proton therapy for paediatric abdominal neuroblastoma
Authors: Ana-Cristina Ghica1, Daniela Botnariuc1,2, Mohammad Hussein2, Vasilis Rompokos3, Derek D'Souza3, Mark Gaze3, Jennifer Gains3, Pei Lim3, Catarina Veiga1
1University College London, Centre for Medical Image Computing, London, United Kingdom; 2National Physical Laboratory, Medical Radiation Science, Teddington, United Kingdom; 3University College London Hospitals NHS Foundation Trust, Radiotherapy, London, United Kingdom
Show Affiliations
Hide Affiliations
Purpose or Objective
Day-to-day variations in the gastrointestinal (GI) tract contents may affect the robustness of proton therapy (PT) plans, leading to target coverage loss and/ or overdosage of organs-at-risk (OARs). We investigated the impact of simulated GI filling variations on the dosimetry of paediatric abdominal neuroblastoma PT.
Material and Methods
Data from a historical cohort of 20 high-risk abdominal neuroblastoma paediatric patients replanned for pencil beam scanning PT (21Gy[RBE] in 14 fractions) was used in this study. To infer the impact of bowel filling variations on dosimetry, the Hounsfield units (HU) within the GI tract were replaced on the planning CT to six homogeneous scenarios: HU = {50, 0, -100, -500, -700, -1000}. These aimed to represent bowel contents from solid to gas. Dose distributions were calculated on the nominal and simulated scenarios, and key dose metrics were derived for structures used for plan optimisation (CTV, PTV, kidneys, liver, vertebra). Then each structure-specific dose metric per simulated scenario (PHU) was normalised to the respective value calculated on the nominal plan (Pnm) as (PHU-Pnm )×100/Pnm. The Pearson correlation coefficient (r) was calculated between HU and the average/ standard deviation of the normalised dose metrics for each structure. The patient group was divided into two sub-groups for analysis based on tumour location relative to the kidneys (unilateral vs midline). Lastly, the Homogeneity Index (HI) was calculated for the CTV as D5%/D95%.
Results
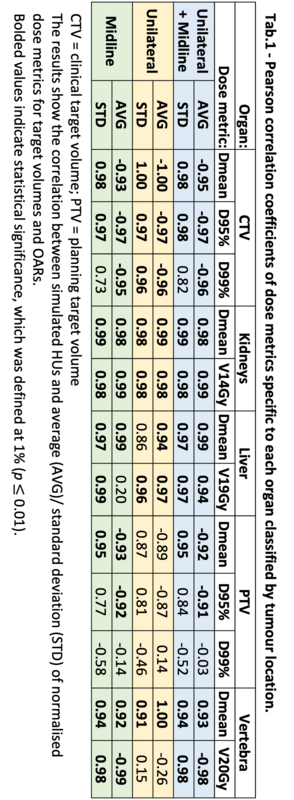
Tab.1 shows the r values between simulated HU and the average/ standard deviation of all normalised dose metrics. The high correlations found indicate that an increase in GI air contents led to increased underdosage (r<0) of targets and overdosage (r>0) of OARs (kidneys, liver). Moreover, the standard variation across the patient group for each dose metric was overall larger in scenarios simulating increased gas contents (r>0). Fig.1 shows the linear regression for CTV D95% and kidneys Dmean. The CTV D95% was reduced in the P-500 scenario by an average of 1.3±1.9 (0.1–6.9)%; while the kidneys Dmean increased by 5.5±16.1 (0.3-68.2)%. Dose distributions within the CTV became less homogeneous as the GI air contents increased with HI = {1.05±0.01, 1.06±0.01, 1.05±0.01, 1.05±0.01, 1.07±0.03, 1.08±0.03, 1.10±0.05} for HU = {nm, 50, 0, -100, -500, -700, -1000}. Midline tumours experienced overall larger changes for most dose metrics than unilateral tumours, with differences between the groups becoming clear from HU = -500 (Fig.1a). One exception was liver V19Gy which was more robust to bowel contents variation for midline tumours.

Conclusion
Target coverage loss, overdose of OARs, and reduced target homogeneity were commonly found when GI air content increased, particularly for midline tumours. Simulating scenarios with -500 HU during plan evaluation may help identify PT plans where variation in bowel filling could impact key dose metrics, such as dose to kidneys.