A framework to link 3D radiotherapy to 2D ophthalmological findings
Mohamed Kilany Hassan,
The Netherlands
PO-1224
Abstract
A framework to link 3D radiotherapy to 2D ophthalmological findings
Authors: Mohamed Kilany Hassan1, Buket Kinaci-Tas1,2, Frank Dankers1, Berend Stoel3, Lukas Stalpers4, Frank Verbraak5, Coen Rasch1, Tanja Alderliesten1
1Leiden University Medical Center, Radiation Oncology, Leiden, The Netherlands; 2Amsterdam University Medical Centers, Ophthalmology, Amsterdam, The Netherlands; 3Leiden University Medical Center, Radiology, Leiden, The Netherlands; 4Amsterdam University Medical Center, Radiation Oncology, Amsterdam, The Netherlands; 5Amsterdam University Medical Center, Ophthalmology, Amsterdam, The Netherlands
Show Affiliations
Hide Affiliations
Purpose or Objective
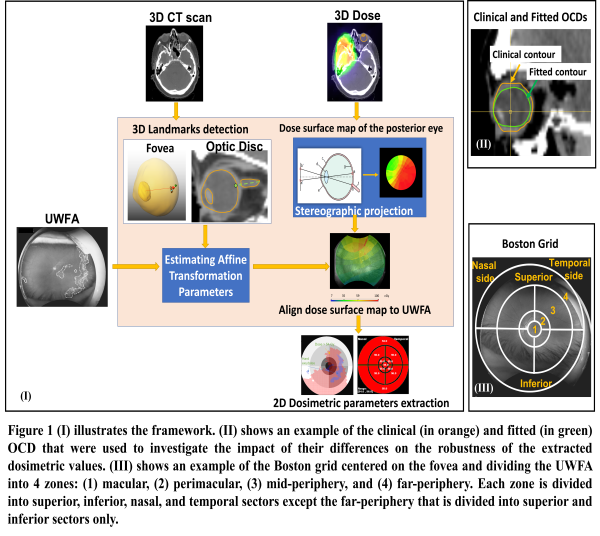
Radiation-induced retinopathy (RR) is a potential side effect of radiation treatment for head and neck tumors because of partial eye irradiation. 2D ultra-wide-field fluorescein angiography (UWFA) is a standard ophthalmological test to measure RR. The severity of RR is likely to be correlated with the radiation dose to the retinal surface. To enable investigation of the relationship between the 3D dose distribution and RR, we developed a framework that can link the 3D dose distribution to UWFA-based RR findings. Further, we assessed the impact of variability in ocular contour delineation (OCD) on the robustness of the extracted dosimetric values from the 3D dose distribution, and their applicability in a potential future dose-response model.
Material and Methods
Retrospective data were retrieved for 10 patients treated for head and neck cancer (2009-2018). The dataset per patient included a planning CT scan, 3D dose distribution, and clinical OCD. Recently (2022), follow-up UWFAs of the same patients were acquired and used to delineate the observed RR. As we aim to link the retinal 3D dose to the RR, an extra set of OCDs was derived by fitting the clinical one to the patient's inner retinal surface (Figure 1-II) using an in-house developed tool. The optic disc, estimated fovea landmark, and dose to the posterior surface of each OCD were projected to a 2D plane using stereographic projection. The projected dose surface maps were aligned with the corresponding UWFA using affine transformation based on the aforementioned landmarks (Figure 1-I). The Kolmogorov–Smirnov (K-S) test was used to compare the cumulative dose area histogram of the projected dose distributions from the clinical and fitted contours. Further, a Boston grid was used to divide the UWFAs into sectors (Figure 1-III). The minimum, maximum, mean, and standard deviation of dose per sector were exported as potential input parameters of a prediction model. Next, a K-S test was performed on these model parameters derived from both contours to investigate their similarity.
Results
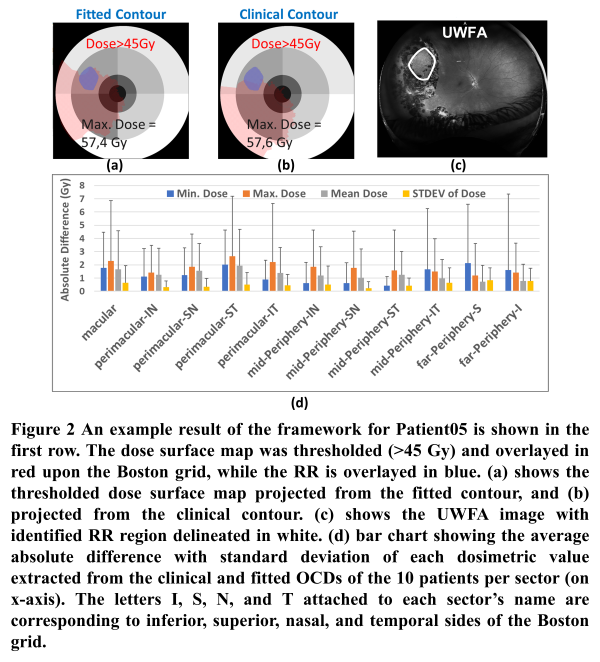
Figure 2 (a-b) shows the spatial relation between the observed RR in UWFA and corresponding 3D retinal dose as derived using the framework. Alteration in the spatial dose distribution associated with the two tested OCDs was noticed. The K-S test showed a significant difference in the projected dose from each contour (median p-value=0.0,95%CI=[0.0,0.05]). However, the K-S test for the model’s parameters showed no significant differences between parameters extracted from each contour (median p-value=0.94,95%CI=[0.69,1.00]).
Conclusion
The framework allows joint visualization of the dose distribution and UWFA findings which enables detailed investigation of dose-effect relationships. Variability in OCD resulted in a significant difference in retinal dose distribution. However, the extracted model parameters were robust to the difference in OCD. Accordingly, a prediction model based on the investigated parameters would not be sensitive to OCD variability.