The efficiency of Atlas-Based Segmentation for head and neck patients used in RayStation
Lisanne van Klaveren,
Switzerland
PO-2324
Abstract
The efficiency of Atlas-Based Segmentation for head and neck patients used in RayStation
Authors: Lisanne van Klaveren1, Joke van der Klein1, Paul Rietveld1, Erik Kouwenhoven1, Jaap van Egmond1, Marc van Ruler1, Jaap Zindler1, Mirjam Mast1
1Haaglanden Medisch Centrum, Radiotherapy, Leidschendam, The Netherlands
Show Affiliations
Hide Affiliations
Purpose or Objective
Contouring the Organs at Risk (OAR’s) in head and neck cancer patients for the purpose of generating a treatment plan is time consuming. The planningsystem RayStation contains a semiautomatic contouring function, i.e. Atlas-Based Segmentation (ABS), based on contours manually drawn by experts. With this function OAR contours can be generated on a new CT-scan. The question is if these generated structures have the same quality compared to manually drawn structures and how much time can be saved in the delineation process.
Material and Methods
The quality of the OAR was determined by the Dice Similarity Coefficient (DSC), this represents the overlap of manually drawn and atlas generated OARs. Also a visual check has been performed on several CT-scans to determine the amount of adaptations that will be needed after generating each OAR. Manually drawn contours of CT-scans of head and neck patients were used for a test phase. The test phase consisted of six atlases containing an increasing number of CT-scans, to determine the influence of atlas on quality of the delineated OAR. On 24 other CT-scans 9 OAR’s were manually contoured by experts only for this research. These scans were used to create the definitive atlas. This atlas was applied on several CT-scans that were also used to create the atlas and compared with the manually delineated OARs (internal cohort). And on CT-scans that already contained clinical used OAR’s (external cohort). The time has been measured on all the steps in the process.
Results
The results of the test phase show that the DSC score was 7% higher on an average in the atlas that contained 30 CT-scans compared to the atlas containing 5 CT-scans.
The mean DSC found in the internal cohort was 0,742 and in the external cohort 0,696. The visual check showed that 27% of the slices were perfectly generated, 58% of the slices needed some adjustments and 15% of the slices were incorrectly generated. The OAR’s that gave the highest DSC scores were the mandible and the oral cavity, the lowest was measured on the submandibular glands. Figure 1 shows the results on one patient of the generated structures by ABS and the manually drawn structures. The results of the test phase, the internal and external cohort and the visual checks are graphically drawn in figure 2.
Manually contouring nine OAR’s per patient took 35 minutes on average. When using the ABS it took 20 minutes to generate and adapt the structures.
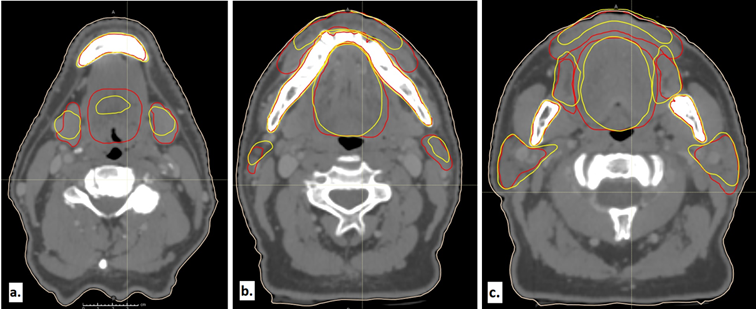
Figure 1 comparison manually drawn (red) and generated by atlas (yellow)
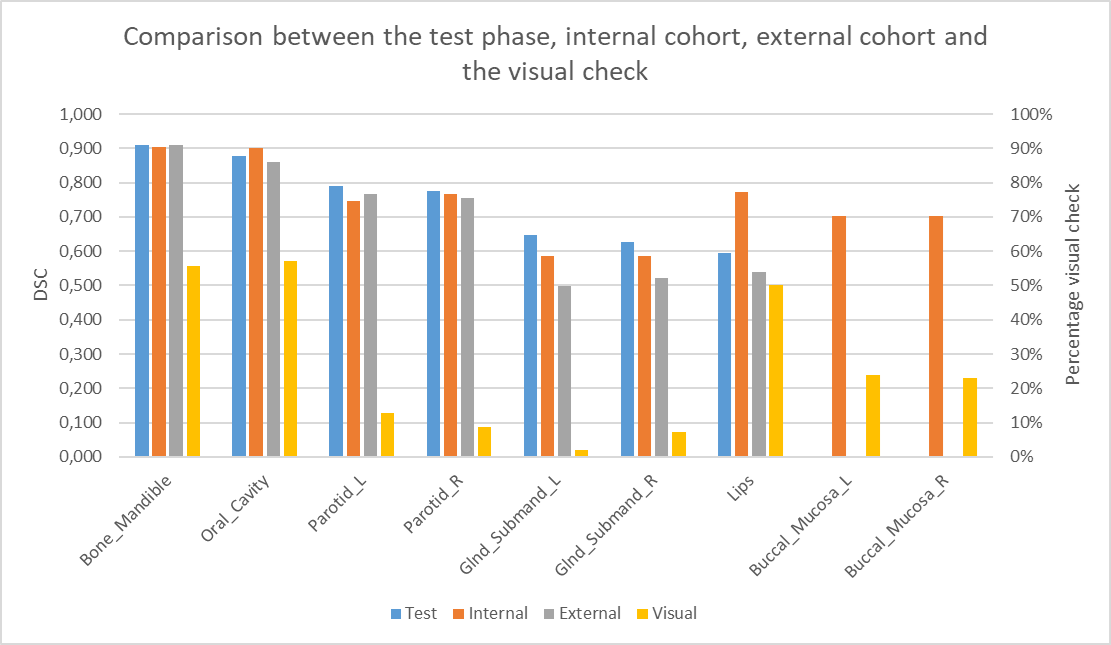
Figure 2 comparison between test phase, internal cohort, external cohort (DSC) and visual check (percentage perfect generated slices)
Conclusion
The structures generated by ABS bring a good starting point that only needs adjustments to us clinically. When using ABS it can save 15 minutes in the delineation process.