Quantifying movement of optical structures during radiotherapy treatment
Femke Vaassen,
The Netherlands
PO-1868
Abstract
Quantifying movement of optical structures during radiotherapy treatment
Authors: David Hofstede1, Femke Vaassen2, Catharina M.L. Zegers1, Nikolina Birimac3, Inge Compter1, Wouter van Elmpt1, Daniëlle B.P. Eekers1
1Maastricht University Medical Center+, GROW School for Developmental Biology and Oncology, Department of Radiation Oncology (Maastro), Maastricht, The Netherlands; 2Maastricht University Medical Center+, GROW School for Developmental Biology and Oncology, Department of Radiation Oncology (Maastro), Maastricht , The Netherlands; 3Maastricht University Medical Center+, GROW School for Developmental Biology and Oncology, GROW School for Oncology, Maastricht University Medical Centre+, Maastricht, The Netherlands
Show Affiliations
Hide Affiliations
Purpose or Objective
Radiotherapy in proximity of (peri)orbital structures is challenging due to the complexity, dose-sensitiveness, and mobility of these structures. To ascertain whether movement and position of optical structures are significant in treatment planning and execution, knowledge of the extent of movement is necessary to evaluate the margin for these organs-at-risk (PRV). This study aimed to quantify the intra- and inter-patient movement of 7 optical structures during the course of radiotherapy treatment.
Material and Methods
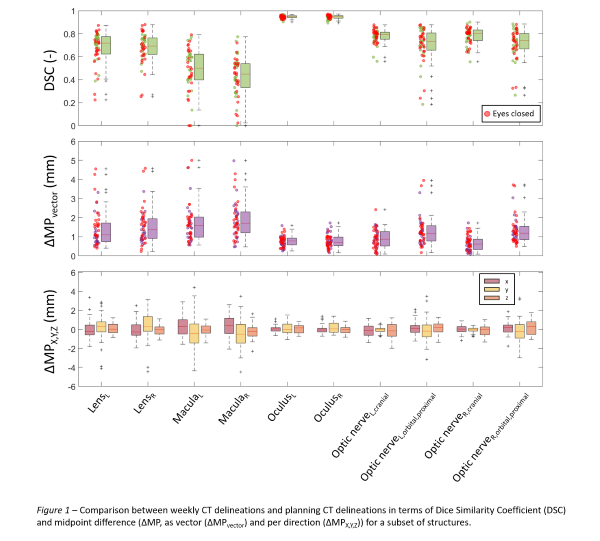
Retrospectively, 10 neuro-oncological patients treated with proton therapy without any orbital conditions or morbidities were included. These patients received 5 weekly CTs (reCT) additional to the planning CT (pCT) as part of their regular treatment. For each CT, 7 optical structures were delineated bilaterally using the EPTN-atlas (Eekers 2018, Eekers 2021): cornea, fovea, lacrimal gland, lens, macula, optic nerve and retina. The delineation of the optic nerve was divided in 3 regions: distal and proximal intra-orbital and intra-cranial. As a control, both oculi were delineated; displacement observed in the oculi could indicate inaccuracies in image registration, delineation, or set-up. The eyelids’ status during CT were scored (open/closed). The reCT delineations were copied to the pCT by rigid registration and compared to the pCT delineation using Dice Similarity Coefficient (DSC), volume difference reCT-pCT (ΔV), and midpoint difference (ΔMP). Reported are the median, 5th and 95th percentiles.
Results
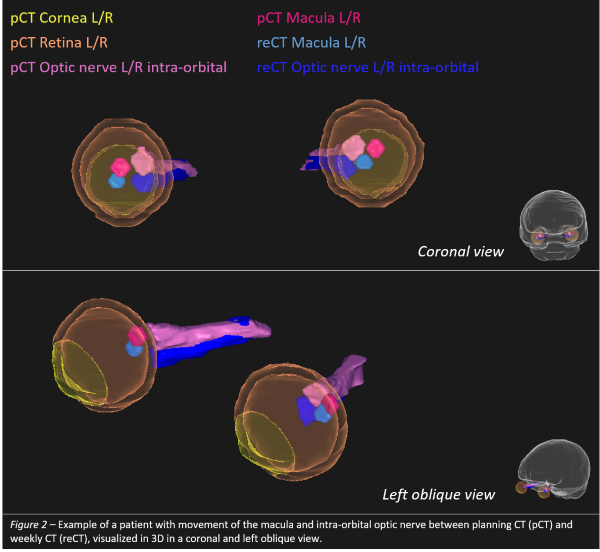
The left retina had the highest 95th percentile DSC (0.90) but also highest 95th ΔV (1.04cm3); the left macula the lowest 5th DSC (0.00). Within the optic nerve regions, ΔMP was highest for the proximal intra-orbital region (up to 3mm in Y-direction). The left macula had the highest 95th ΔMPvector (4.6mm). The oculi ΔMPvector was at most 2mm. Highest 95th ΔMPx, ΔMPy, and ΔMPz were found for the left cornea (2.4mm), left fovea (3.8mm), and left optic nerve (1.7mm), respectively. Fig. 1 depicts the vDSC and ΔMP for a subset of structures. In general, ΔMPy was greater than ΔMPx and ΔMPz. Closed eyes during CT showed more movement. An example patient with movement of the macula and intra-orbital optic nerve between pCT and reCT is shown in Fig. 2.
A PRV-like margin was calculated from the 95th percentiles of ΔMP, representing the movement of structures for 95% of the reCTs. In this study, a PRV-margin of 3-4mm would be needed for the cornea, fovea, lenses, macula and proximal intra-orbital optic nerves. Separate margins can be specified for X, Y, and Z-directions.
Conclusion
Movement of optical structures was present for most patients during reCTs in this study. This indicates a PRV-margin is recommended in clinical practice to account for this movement. Additional dosimetric analysis is necessary to confirm the dosimetric impact of this movement. Future research could include gaze instructions during scans to analyze if this decreases the positional difference in this study.