Correlation between tolerances for EPID metrics and CI dose deviation for patient-specific VMAT QA
PO-1751
Abstract
Correlation between tolerances for EPID metrics and CI dose deviation for patient-specific VMAT QA
Authors: GUADALUPE MARTIN1
1Hospital Universitario de Fuenlabrada, Medical Physics Department, Madrid, Spain
Show Affiliations
Hide Affiliations
Purpose or Objective
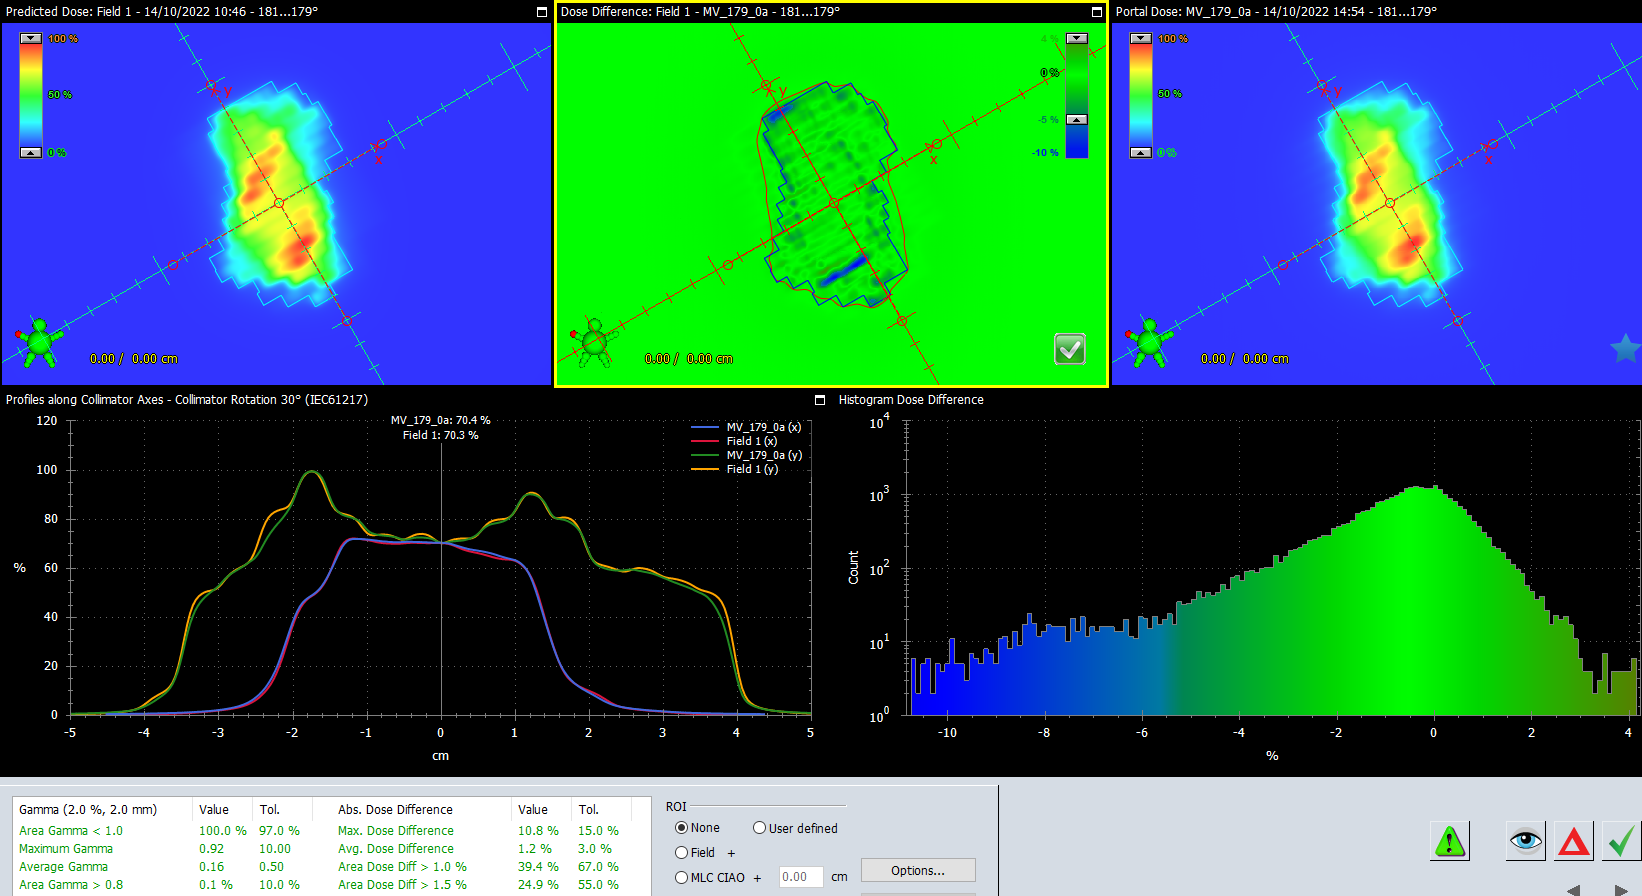
In our Centre, patient-specific VMAT QA for SBRT treatments is performed in a Varian TrueBeam linac by means of the EPID to obtain 2D dose distributions measurements and with point-dose measurements performed with an ionization chamber (IC) placed inside an IMRT phantom. Dose differences between EPID measurements versus calculated dose distributions in Eclipse TPS are analyzed by means of the Portal Dosimetry (PD) analysis tool in terms of CU values (EPID arbitrary absolute dose units calibrated in terms of MU linac calibration) (Fig.1). Tolerances for passing or rejecting a certain plan based on CU values are available within the PD module as a template with different metrics for CU values. These templates include Varian recommended tolerances for CU metrics but we could not find how to correlate these tolerances with the well-established 2% dose deviation tolerance for point-dose measurements with an IC. Our goal was to find a relationship between these CU metrics tolerances and the 2% IC dose deviation tolerance to determine an action level when using the PD tool
Material and Methods
Errors of up to 1 cm (with 1 mm steps) were introduced between EPID-acquired measurements and those calculated within the PD module for a VMAT SBRT treatment plan. Variation in CU values in relative mode for each 1 mm shift were analyzed for the following metrics: Maximum Dose Difference, Average Dose Difference, Area Dose Difference>1% and Area Dose Difference>1.5%. Similarly, the same offsets were introduced for point-dose measurements performed with an IC placed in an IMRT phantom. Dose deviations from TPS calculations resulting from offset shifts in the IC were compared with the corresponding CU metrics deviations to find a correlation between them.
Results
The CU metrics that showed the highest correlation when introducing offsets in the IC and in the PD were Area Dose Difference >1% and >1.5% (Fig.2). Based on the resulting linear regression (R= 0.9) we were able to obtain a relationship between IC dose-deviation and Area Dose Difference CU 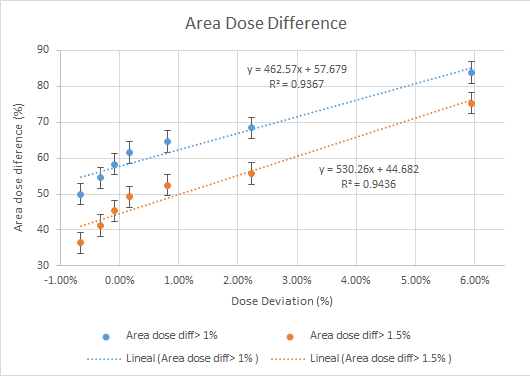 values and hence, tolerance limits for these CU metrics consistent with the 2% tolerance for the IC. To show the validity of these new CU tolerances we assessed 20 patients whose CU tolerance limits were in agreement with IC tolerances.
Conclusion
CU Area Dose Difference tolerance for Varian PD have been determined to correlate with IC point-dose measurement tolerance for VMAT patient-specific QA