Integration of R2* mapping in daily prostate MR-Linac workflow for hypoxia characterisation
Wajiha Bano,
United Kingdom
PO-1751
Abstract
Integration of R2* mapping in daily prostate MR-Linac workflow for hypoxia characterisation
Authors: Wajiha Bano1, Kobika Sritharan2, Joan Chick1, Gillian Smith3, Alison Tree2, Uwe Oelfke4, Andreas Wetscherek4
1The Institute of Cancer Research and The Royal Marsden NHS Foundation Trust, Joint Department of Physics, London, United Kingdom; 2The Royal Marsden NHS Foundation Trust and The Institute of Cancer Research, Department of Radiotherapy, London, United Kingdom; 3The Royal Marsden NHS Foundation Trust, Radiotherapy, London, United Kingdom; 4The Institute of Cancer Research, and The Royal Marsden NHS Foundation Trust, Joint Department of Physics, London, United Kingdom
Show Affiliations
Hide Affiliations
Purpose or Objective
R2*
mapping can be used to characterize tumour hypoxia, which is associated
with therapy resistance. Acquiring R2* maps during MR-guided
radiotherapy can potentially help in treatment adaptation by escalating the dose
to resistant sub-volumes. This study aims to evaluate R2*
changes in patients with prostate cancer undergoing radiotherapy on an MR-Linac.
Material and Methods
Seven
patients with prostate cancer received radiotherapy after androgen deprivation
therapy with a dose of 60Gy/48.6Gy to prostate and seminal vesicles in 20
fractions. Patients were treated on a 1.5T MR-Linac (Elekta AB. Stockholm,
Sweden) and R2* mapping was acquired twice per week
before treatment delivery using a radial multi-echo gradient-echo sequence with
the following parameters: TR = 48 ms, ΔTE=5ms, FOV = 400x400x180 mm, and
1.5x1.5x4 mm3 acquisition voxel size, TA= 7.56 minutes). R2*
maps were calculated from the magnitude images in MATLAB (The Mathworks,
Natick, MA, USA) using a linear operation on the R2* exponential
decay curve. Prostate was delineated manually and mean R2*
values within the whole prostate were compared across all fractions. The first day
of treatment (fraction 0) was considered baseline and the last five fractions
(15-20) were considered as an end of treatment. Statistical analysis was performed using Graphpad
Prism.
Results
Figure 1a shows
the mean R2* values during the course of radiotherapy. Baseline mean R2* values
varied across different patients, which could be attributed to the inter-patient
variability. Repeated measure ANOVA showed no statistically significant
difference in R2* values across different fractions (p=0.24). This variability can be seen
visually in R2* maps of two patients across different
fractions (Figure 1b).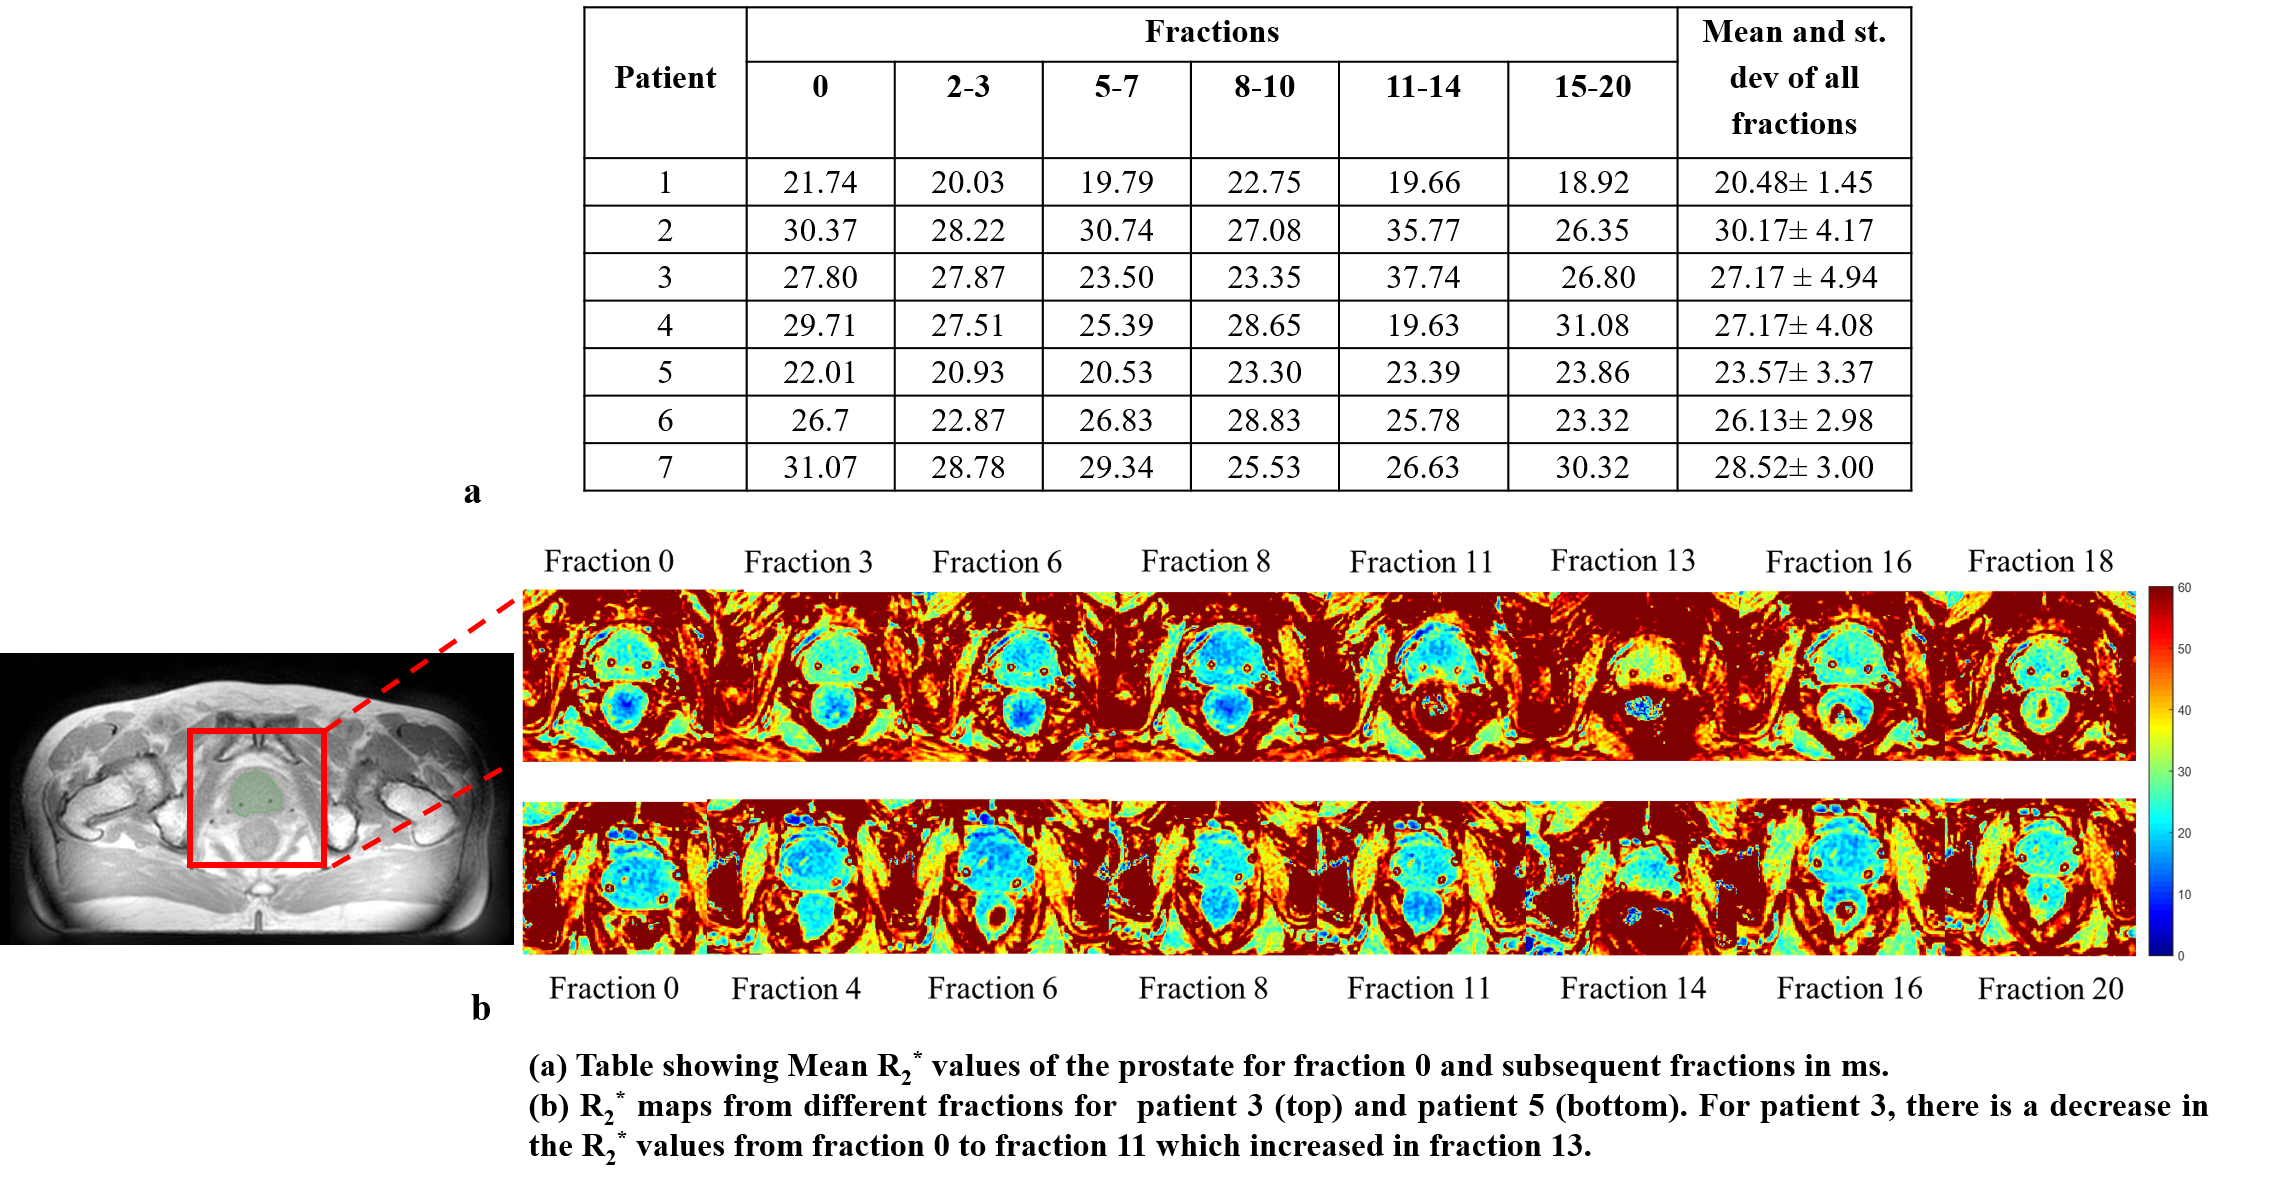 Figure
2 shows the comparison of R2* values during fraction 0
(before radiotherapy) and R2* of all the last five
(15-20) fractions. There is a decrease in R2* values in five
out of seven patients as compared to baseline. The difference between R2*
values within the prostate of fraction 0 and fraction 15-20 was not statistically
significant (paired t-test, p=0.2). There
was a significant correlation between fraction 0 and fraction 15-20 R2*
values (r=0.82, p=0.008).
Figure
2 shows the comparison of R2* values during fraction 0
(before radiotherapy) and R2* of all the last five
(15-20) fractions. There is a decrease in R2* values in five
out of seven patients as compared to baseline. The difference between R2*
values within the prostate of fraction 0 and fraction 15-20 was not statistically
significant (paired t-test, p=0.2). There
was a significant correlation between fraction 0 and fraction 15-20 R2*
values (r=0.82, p=0.008).

Conclusion
This
was an exploratory study to evaluate the weekly changes in R2*
values for prostate cancer patients undergoing radiotherapy on an MR-Linac.
There was no persistent change in R2* values in all
patients with an overall decrease in R2* in five out of
seven patients at the end of treatment. This
decrease in R2* values could be indicative of the
fibrosis or apoptotic changes in the prostate. This work focused only on the
changes within the whole prostate in a limited number of patients and future work
will evaluate the voxel-level changes in the tumour. The correlation of R2* with
clinical and quantitative parameters (e.g diffusion) may help characterise
the nature of these changes and can be useful for adaptive radiotherapy.