Simple model for a 3D assessment of peripheral dose in coplanar isocentric photon radiotherapy
Beatriz Sanchez Nieto,
Chile
PO-1576
Abstract
Simple model for a 3D assessment of peripheral dose in coplanar isocentric photon radiotherapy
Authors: Ignacio López-Martínez1, Ignacio Espinoza1, Beatriz Sánchez-Nieto1, Jose Rodríguez-Mongua2
1Pontificia Universidad Católica de Chile, Instituto de Física, Santiago, Chile; 2Fundación Arturo López Pérez, Radioterapia, Santiago, Chile
Show Affiliations
Hide Affiliations
Purpose or Objective
Peripheral dose
is an issue of growing interest in today’s radiotherapy, as it contributes to
the generation of deterministic late-effects on organs near the field edge as
well as secondary cancer. The impact of out-of-field doses is particularly
relevant for IMRT treatments, which are typically characterized by large
irradiated volumes to low doses. Although this dose is not negligible, it is
usually ignored, and then the cancer risk associated with the treatment.
Knowing the dose to any organ within the patient would allow generating more
personalized therapies. This work presents a new model that calculates
peripheral photon dose (PPD) in 3D outside the 5% isodose. The model is easy to
use, fast, and only requires two treatment parameters.
Material and Methods
Considering the
physical sources of PPD and a Monte Carlo (MC) simulation of a reference
treatment (eight coplanar isocentric 10x10 cm2 square fields equally distributed at
mid-abdomen on the ICRP110 phantom), an analytical expression for PPD, as a
function of the point´s position within the patient, was proposed. The model
was fitted to the MC data using MATLAB (for doses outside the 5% isodose).
Then, it was tested with a) experimental (TLD) data from a VMAT prostate
treatment, and b) MC simulation of three 5x5 cm2 fields lung treatment on the ICRP110 phantom.
A graphical user interface (GUI) was created to calculate the PPD 3D
distribution on any CT.
Results
Maximum
differences between our PPD model prediction and the data from the MC lung plan
and measured data from VMAT plan, were 29 and 9 and mGy/Gy, respectively. The PPD
distribution on the abdomen (isodoses on a coronal plane) is depicted in figure
1. A screenshot of the GUI for the lung plan showing
the PPD on a transversal view is shown in figure 2. The GUI allows for fast
visualization of the 3D dose distribution in a loaded CT and the dosimetric
information (DVH, maximum, minimum, and average organ dose) of outlined organs
(in this example, heart)
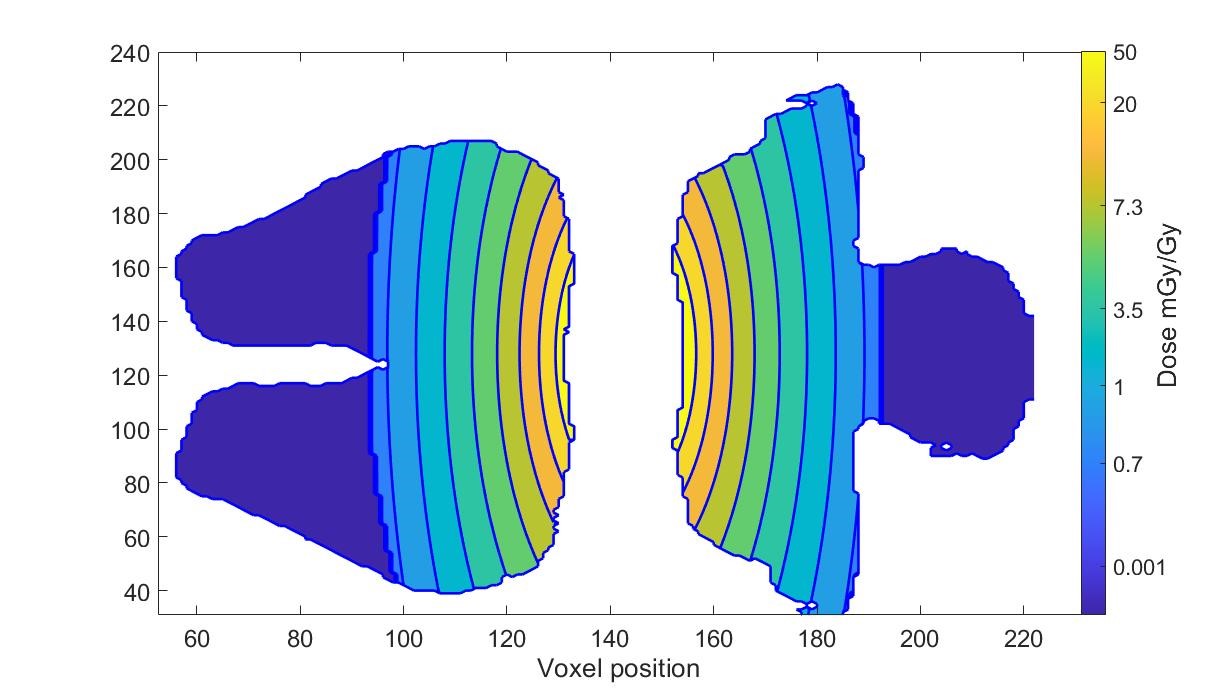
Figure 1 Coronal view of PPD dose
distribution on the ICRP110 of the eight-field abdomen plan. The central region
is not shown as it belongs to the volume inside the 5% isodose, which is not
considered by the model.
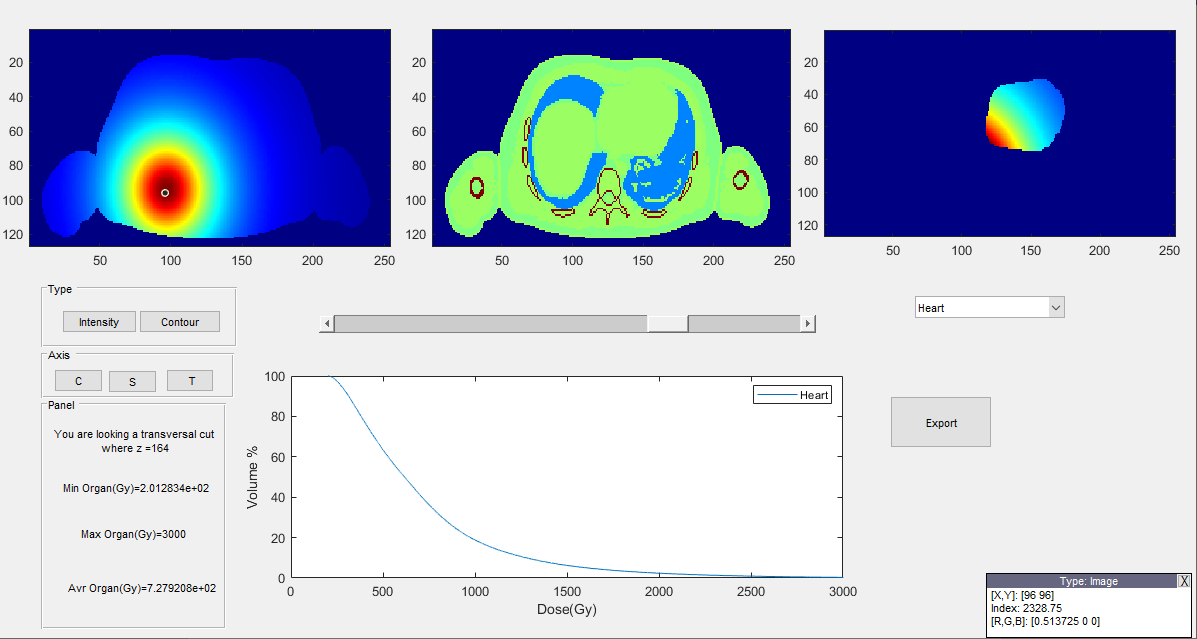
Figure 2 Upper left shows PPD at a transversal plane on the
ICRP110 in a lung treatment (dose normalized to the slice). The upper right
window shows the PPD on the organ (heart in this case). The cumulative DVH for
the organ is depicted.
Conclusion
A relatively
simple model (Periphocal 3D) was generated. It allows for a fast 3D calculation
of PPD in isocentric treatments with coplanar beams. This information is
essential for a more accurate estimation of secondary cancer risk at the organ.
In addition to that, and as a first step to translating the research to the
clinic, a GUI was created in MATLAB for 3D visualization of PPD calculated on
any whole-body CT (see abstract E22-1144). The GUI allows
visualization of PPD distributions, as well as the DVH of out-of-field organs.
Acknowledgments: Fondecyt N1181133