Comparison of PRO and PO algorithms in Rapid arc (VMAT) delivery for Head and Neck SIB treatments
Venugopal Sundaram,
India
PO-1545
Abstract
Comparison of PRO and PO algorithms in Rapid arc (VMAT) delivery for Head and Neck SIB treatments
Authors: VENUGOPAL SUNDARAM1, Govind Rao2, Moujhuri Nandi1, Vaishnavi Peruma Reddy1, Neelima pokhala1, Kaustav Mondal1, Aditya Prakash3, Manjulika Bhattacharjee1
1Meherbai Tata Memorial Hospital, Department of Radiation Oncology, Jamshedpur, India; 2Meherbai Tata Memorial Hospital, Radiation Oncology, Jamshedpur, India; 3Tata Main Hospital, Department of Radiation Oncology, Jamshedpur, India
Show Affiliations
Hide Affiliations
Purpose or Objective
The aim of this study is to analyze and verify characterization of two different algorithms using Simultaneous integrated boost (SIB) in Head and Neck plans.
Material and Methods
In our study 15 patients were selected, who received radiation therapy by using Eclipse VMAT Progressive Resolution Optimizer algorithm 15.1. The same cases were re-optimized using a PO algorithm 15.6.A total of 30 treatment plans (15 PRO-VMAT plans and 15 Photon Optimizer-VMAT plans) were produced in the present study. All plans were created using double full arcs, keeping the identical constraints, cost functions and optimization time. Plan evaluation was done using PTV parameters (D98%, D95%, D50%, D2% mean dose and V105%), Homogeneity index (HI), Conformity index (CI), MU per degree with control points (CP), OAR doses and gamma verification (Portal dose and ArcCHECK) values were evaluated. Treatment was delivered in Varian Truebeam 2.5, energy 6 MV with Millennium 120 MLC.
Results
The PTV coverage (D95%) for PRO and PO were 98.69 Gy ± 0.83, 98.80 Gy ± 0.94, HI were 0.093 ± 0.022 and 0.086 ± 0.020, CI were 0.987 ± 0.008 and 0.988 ± 0.009. Monitor units (MU) for PRO and PO were 647.47 ± 137.88, 655.17 ± 138.36. The Portal dose results were (3%,3mm (%) & 1%,1mm (%)) for PO and PRO 100 ± 0.06, 95.1 ± 1.37 and 100 ± 0.05, 95.2 ± 1.32. For ArcCHECK 99.95 ± 0.12, 94.67 ± 3.01 and 99.95 ± 0.07, 93.55 ± 3.86 respectively. OAR’s dose results are given below table 1
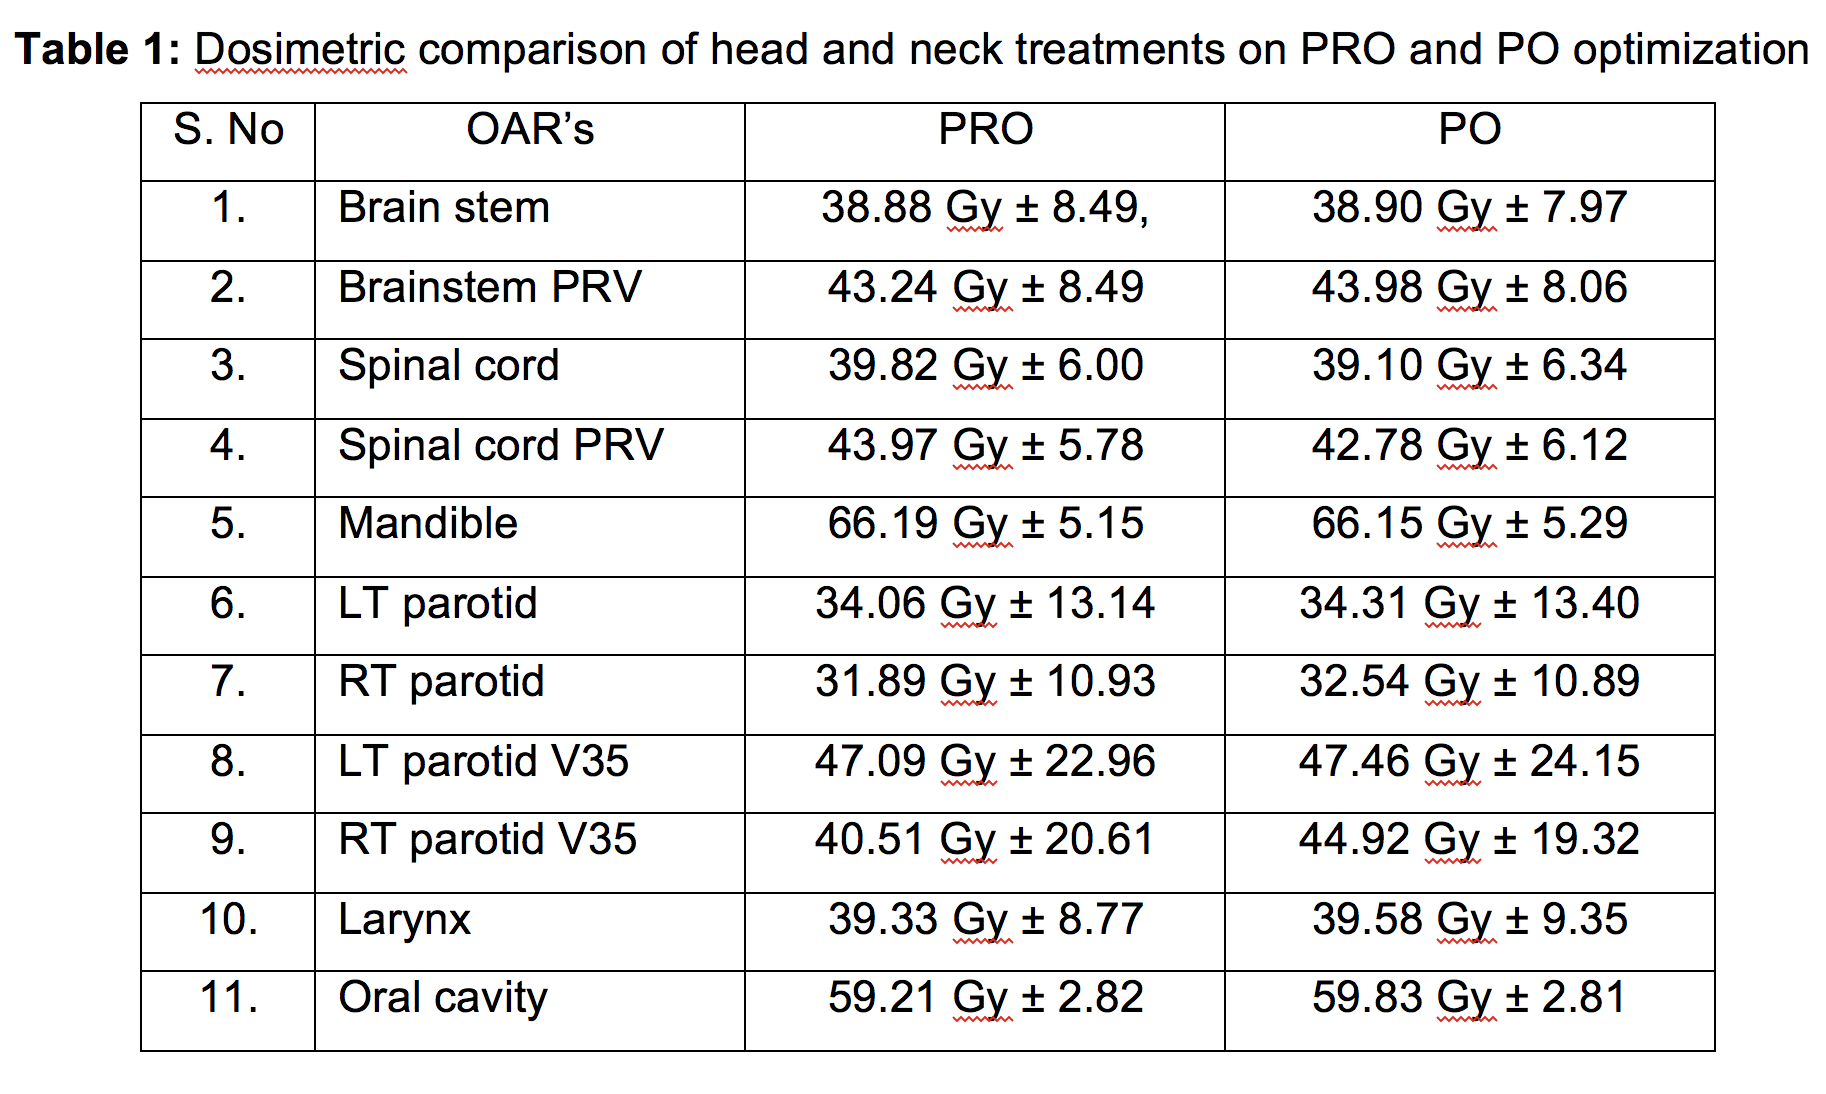
Conclusion
Results showed that PTV coverage and OAR’s doses were comparable. For individual patients CI and HI of PO showed slightly higher values than PRO. MUs for PO were slightly increased as compared to PRO. MU per degree with each individual control points generated by PO showed high degree of modulation compared to PRO. Hence, new PO optimizer can produce comparable degree of plan while using same PRO objectives.