Dose mimicking by deep learning based fluence prediction: one model for different class solutions
Liesbeth Vandewinckele,
Belgium
PD-0819
Abstract
Dose mimicking by deep learning based fluence prediction: one model for different class solutions
Authors: Liesbeth Vandewinckele1,3, Siri Willems2,4, Maarten Lambrecht1,3, Frederik Maes2,4, Wouter Crijns1,3
1KU Leuven, Experimental Radiotherapy, Leuven, Belgium; 2KU Leuven, ESAT/PSI, Leuven, Belgium; 3UZ Leuven, Radiation-Oncology, Leuven, Belgium; 4UZ Leuven, Medical Imaging Research Center, Leuven, Belgium
Show Affiliations
Hide Affiliations
Purpose or Objective
Current research in radiotherapy treatment planning is
directed toward 3D dose predictions. Usually a dose mimicking optimization
process is used to translate the 3D dose predictions into treatment device
parameters, which is time consuming and based on 1D DVH information. Recently,
fluence predictions based on 3D dose information using CNNs have been proposed
as an alternative. Proof of principle publications create a model for one
specific class solution (beam setup and treatment device). Here, we investigate
the possibility to transfer a CNN-based fluence prediction model for lung IMRT trained
on our Hacyon class solution to a TrueBeam STx class solution with another beam
setup, for which no training data is available.
Material and Methods
A dataset of 153 lung cancer
patients, treated with IMRT, is available. For these patients the beam dose
distribution and fluence map for each field is exported from EclipseTM.
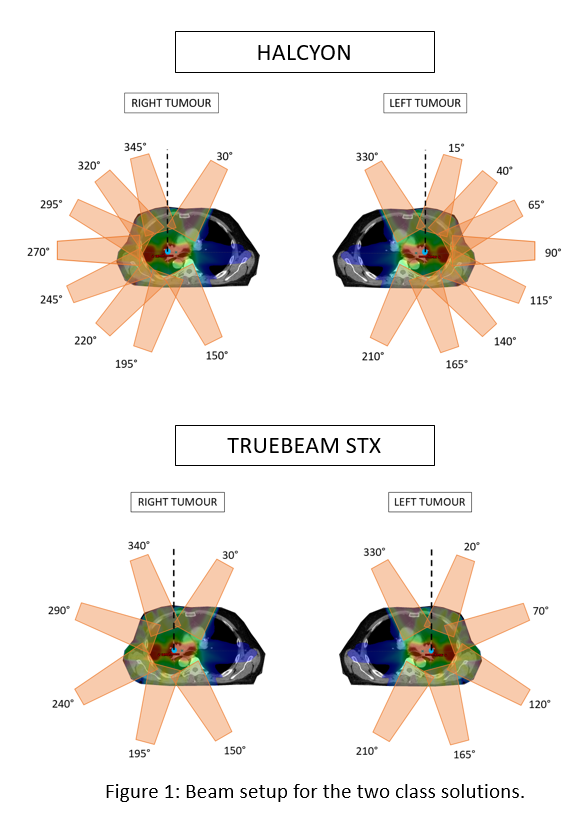
The training (n=97) and validation set (n=30) contain patients treated on a
Halcyon device with energy 6MV-FFF with either SX1 (1cm leaf width) or SX2
(0.5cm virtual leaf width) and a 9 beam setup, see Figure 1. In the test set
(n=26), the patient plans are created for a TrueBeam STx device (0.25 cm leaf
width) with the same energy, but a 6 beam setup, see Figure 1. The CNN has 1
input: the 3D beam dose distribution, rotated according to the beam’s axis
(gantry and collimator angle) and one output: the fluence map of the
corresponding beam. A 2D Unet is used and the 3D dose input is given as
multiple 2D channels to the network. After fluence prediction, the fluences are
imported in the treatment planning system for dose calculation.
Results
Per patient, the workflow takes on average 137s for preprocessing of the doses and 0.96s for
fluence prediction. The results of the clinical plans vs. the plans obtained after fluence
prediction can be found in Figure 2 and Table 1. All plans are normalized to
have a dose of 1 Gy as mean dose in the PTV. The differences between the mean doses for the clinical constraints between the clinical and predicted plan are
mostly smaller than 2% of the prescribed dose. The largest differences can be
found at D(0.035cc) of PTVs with mean differences of 4% of the prescribed dose.
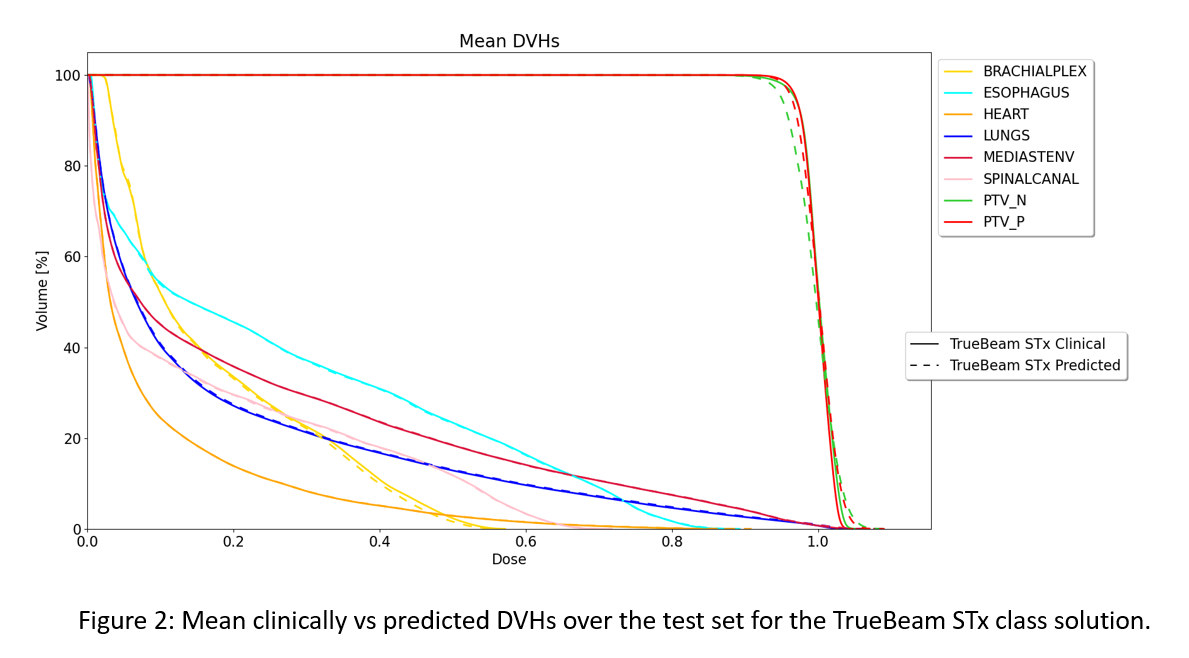
Table 1: Mean±std over the test set, relative to the prescribed dose.
| Clinical | Predicted |
PTV Primary D(99%) D(95%) D(0.035cc)
|
0.95±0.01
0.97±0.01
1.04±0.01
|
0.94±0.01
0.96±0.01
1.08±0.03
|
PTV Nodal D(99%) D(95%)
D(0.035cc)
|
0.94±0.03 0.97±0.01
1.05±0.02
|
0.92±0.03 0.95±0.02
1.09±0.03
|
Brachial
Plexus
D(0.035cc)
|
0.54±0.40
|
0.53±0.39
|
Heart D(mean)
D(0.035cc)
|
0.09±0.07
0.87±0.35
|
0.09±0.07
0.88±0.35
|
Lungs
D(mean)
|
0.18±0.07
|
0.18±0.07
|
Mediastinal
Envelope
D(0.035cc)
|
1.05±0.05
|
1.08±0.06
|
Oesophagus
D(0.035cc)
|
0.86 ±0.25
|
0.87±0.25
|
Spinal
Canal
D(0.035cc)
|
0.70±0.17
|
0.69±0.18
|
Conclusion
It is
possible to transfer a fluence prediction model, trained for a 9 beam
Halcyon class solution, to a 6 beam TrueBeam STx class solution, of which
insufficient data is available to train a separate network.