Direct Density algorithm evaluation
Miguel Garcia Cutillas,
Spain
PO-1664
Abstract
Direct Density algorithm evaluation
Authors: Balbino Fornes García1, Miguel Garcia Cutillas1
1Hospital Clinic de Barcelona, Radiation Oncology, Barcelona, Spain
Show Affiliations
Hide Affiliations
Purpose or Objective
Computed
tomography imaging is usually used in radiation oncology to calculate
radiation dose distributions. In order to do so, HU must be converted into electron densities by an energy dependent
conversion curve, therefore dependent on the X-ray tube voltage. As far as variation on tube voltage among
several acquisitions is needed in order to maximize image quality and minimize
patient dose, it would be desirable, for the sake of simplicity and workflow
robustness, to have a single calibration curves for all tube voltages. In the
present study, we analyze HU variation as function of X-ray tube
voltage among several materials on a phantom and different acquisition
protocols, using reconstruction algorithms with and without direct Density (DD)
algorithm. The aim of this study is to test HU independence when varying kV
tube. It potentially enables the use of a single calibration curve when
calculating dose distributions. It is then, the first step to implement the DD
algorithm in clinical routine.
Material and Methods
- CIRS CBCT Electron
Density Phantom Model 062MA is made up of two structures to simulate head and
body. Employed inserts were lungInhale,
lungExhale, adipose, breast, plastic water, muscle, liver, bone200, bone800 y
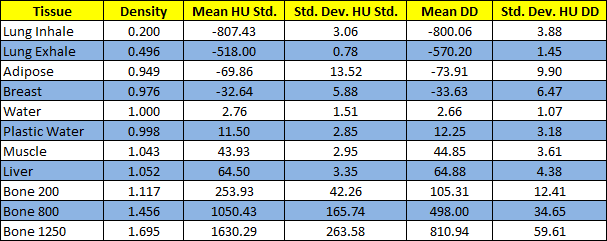
bone1250 with relative electron densities (RED) showed in table 1.
- Serial images were acquired in a TC Siemens Somatom Go.Open Pro (Siemens
Healthineers) which incorporates DD. HU analysis were performed using Eclipse
TPS version 13.7 (Varian Medical Systems)
Variations of tube voltage from 70 kV up to 140 kV in 10 kV increments
were made. Tomographic reconstruction was implemented using standard and DD kernels.
For determining HU of each material, a 2 cm ROI centred in each insert
was created, making sure the ROI did not cover the edge of the insert.
Calibrations curves were introduced into the TPS using the average of
all kV voltages in the case of implementation of DD workflow.
Results
Adjusting all the points representing HU values
for all tissues, kV and protocols to a line regression, we obtain a coefficient
of determination R2=0,995, showing a good correlation of the
data.
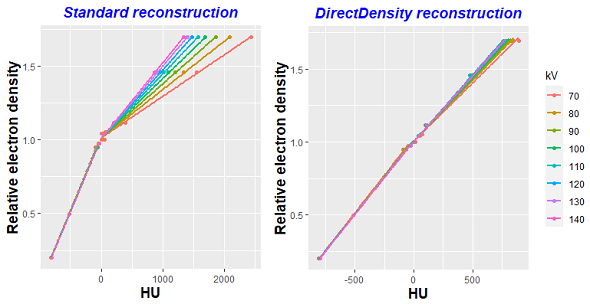
Figure 1 shows the different calibration curves
obtained using standard and DD reconstructions kernels when varying tube kV. It can be seen how DD curves
tend to converge in a single one.
Table 1 shows the different RED inserts and the HU
value for each one of the inserts when averaging for all the tube voltages used. HU standard deviation is displayed showing how, when using DD
reconstruction,It does not rise as much as in the case of high electronic density materials, such as bone inserts.
Conclusion
The first step for implementing DD in clinical routine
has been successfully accomplished as we can use one single calibration curve
for all tube kV and standard deviation on HU remains within acceptable
limits even for high electron density inserts. It would be necessary, however, to seek for dosimetric differences when
comparing two plans, with and without DD algorithm.