Does longitudinal Diffusion-Weighted MRI have the potential to carry biological information?
PH-0214
Abstract
Does longitudinal Diffusion-Weighted MRI have the potential to carry biological information?
Authors: Anne Bisgaard1, Carsten Brink1, Carsten Brink2, Maja Lynge Fransen3, Tine Schytte1,4, Claus Behrens5, Henrik Nissen6, Faisal Mahmood1,2
1Odense University Hospital, Department of Oncology, Odense, Denmark; 2University of Southern Denmark, Department of Clinical Research, Odense, Denmark; 3Odense University Hospital, Department of Radiology, Odense, Denmark; 4University of Southern Denmark, Department of Clinical Research, Odense , Denmark; 5Herlev Hospital, Department of Oncology, Herlev, Denmark; 6Vejle Hospital, Department of Oncology, Vejle, Denmark
Show Affiliations
Hide Affiliations
Purpose or Objective
Introduction
of the hybrid MRI linear accelerator (MR-linac) has made longitudinal
Diffusion-Weighted MR imaging (DWI) more accessible. This allows studying the
temporal changes of quantitative DWI metrics such as Apparent Diffusion
Coefficient (ADC), a promising biomarker for response prediction. ADC
measurement requires delineation of ROIs, which is time-consuming and can be error-prone.
Here, a, semi-automatic computer-based tool for segmentation of dedicated ROIs
(viable tumor volumes, VTV) for ADC
measurement is tested for its capacity to detect potential biological changes.
Material and Methods
A
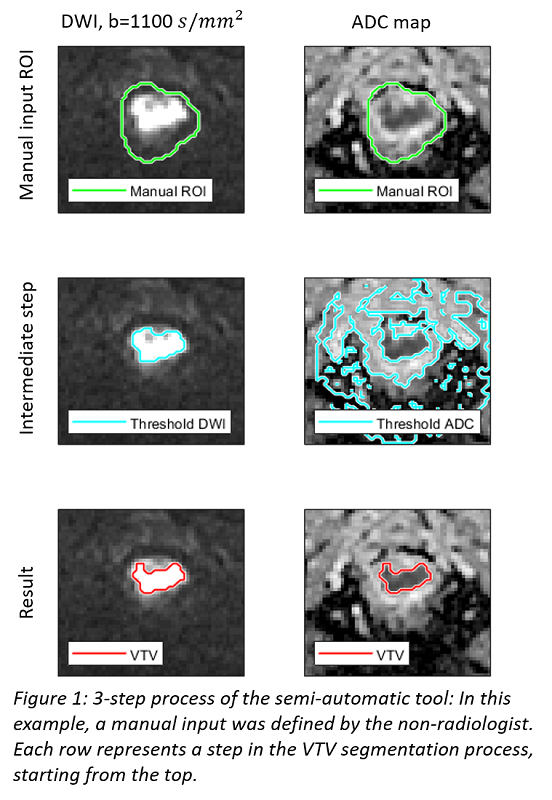
semi-automatic segmentation tool was implemented using in-house developed
software (MatlabR2019a, Mathworks ab, Sweden), as a 3-step process (Figure 1): 1) Manual input for identifying
roughly the relevant region. 2) Two masks are automatically created with high
DWI intensity and low ADC values, respectively, based on Otsu’s method to
identify discrimination thresholds1. 3) The overlap between the two
masks form the resulting VTV.
The tool
was tested in 30 patients with rectal cancer referred to RT and MRI scanned prospectively before
treatment (baseline) and two weeks into RT (week 2). MRI protocol consisted of
T2W imaging and repeated DWI (test-retest). Rigid registration between T2W and
DWI was performed in MIM (MIM Software Inc.). A radiologist manually delineated
GTV and VTV (aided by T2W, DWI, and ADC map). Automatic VTV segmentation using
the tool was performed with manual input given as 1) GTV and 2) a ROI defined
by a non-radiologist.
ADC change
between baseline and week 2 was calculated for both the manual and the
semi-automatic delineation method, and their correlation was measured using Pearsons
correlation coefficient. Image related ADC uncertainty was measured using
test-retest data. Bootstrap of the observed non-normal distribution was used to
establish the central 70% confidence interval.
Results
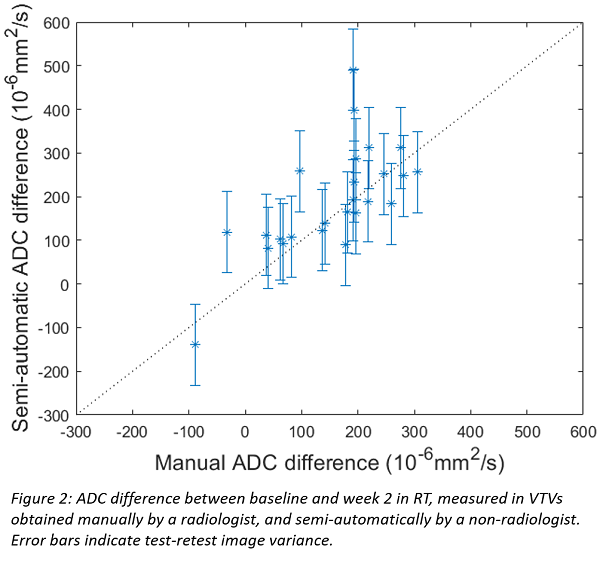
The temporal ADC change between baseline and week 2 measured by the
manual and the semi-automatic delineation method is presented in Figure 2; error bars indicate test-retest
image variance (+/- 92.8 mm2/s). The Pearson correlation
coefficient between manual and semi-automatic VTV delineation was 0.68. Between
the two manual inputs (GTV vs. non-radiologist ROI), the correlation was 0.79. No
association between ADC changes and ADC values were observed.
Conclusion
Longitudinal
ADC changes were larger than image related uncertainty, and thus potentially
reflect treatment related biological changes. The presented semi-automatic segmentation
for ADC calculation was not sensitive to manual input, and correlates well with
manual delineation by a radiologist. The segmentation method may be useful in
other targets than rectal cancer and may be well-matched for the MR-linac
workflow.
References
1. Otsu
N. Threshold Selection Method From Gray-Level Histograms. IEEE Trans Syst Man
Cybern. 1979;SMC-9(1):62-66. doi:10.1109/tsmc.1979.4310076